


A Quick Disclaimer: Backstory & Strategy is a personal, independent publication. The views, analysis, and commentary expressed here are strictly my own and do not represent the official position, strategy, or endorsement of the American Press Institute, its leadership, or its board. This is my personal space for analyzing the media landscape, testing new frameworks, and thinking out loud.
I’ve been talking with a lot of founders lately. These are people who want to start a newsroom in a town that lost one, or never really had one to begin with. They’re smart, committed, and usually right about the need. And after enough of these conversations, I’ve noticed that most of their plans get built in the same order.
First comes the community need. Someone notices the school board meets with nobody watching, or that the only local information source is a Facebook group moderated by whoever has the most free time. Then comes the editorial strategy: what we’ll cover, how, and for whom. The staffing plan follows close behind, because once you know what you want to cover, you know who you need to hire. The technology stack, such as it is, comes next.
And finally, almost as an afterthought, comes revenue. More often than not, that means industry grants.
You can probably guess what’s missing.
Was this forwarded to you? Backstory & Strategy is free, and it’s built on one idea: the hard calls, explained by someone who’s made them. Subscribe here to get the next one.
The spreadsheet problem
It isn’t that founders skip the numbers. Plenty of them show up with stacks of spreadsheets. There’s census data in there, maybe a few industry benchmarks, and a revenue projection that climbs politely up and to the right.
But look at when those spreadsheets arrive. They come after the need, the editorial plan, and the staffing plan have already hardened. By then, the numbers aren’t there to test the idea. They’re there to defend it. The census figure that made the cut is the one that fit, and the benchmark that made it in is the one that flattered.
There’s a simple way to tell the difference. Ask what the numbers would have to show for the plan to change. If nobody has an answer, the spreadsheet isn’t a model. It’s an exhibit.
I don’t say this from a safe distance. I have one of those exhibits, and I published it.
Exhibit A is mine
In August 2025, I wrote a piece here called A Newsroom for Cheltenham: How We Could Build It, and Why It Matters. Cheltenham is my township, about 38,000 people just outside Philadelphia, and it gets a little coverage but nowhere near enough. I called it a news drought, and I laid out a roadmap for a small nonprofit newsroom to end it.
Read it now, and the sequence jumps right out. The problem came first. Then the team: an editor-in-chief, two full-time reporters (one on government and public affairs, one on schools and community life), and money for freelancers and photographers. Each role had a purpose. None had a price.
The prices showed up later, as slices of a pie chart with no numbers on it. Measured, they add up to a Year 1 budget of $450,000, with $270,000 going to salaries and benefits. Every slice comes out to a round number, which is usually what a budget looks like when you start with a total and divide it up, rather than adding up what things actually cost.
Revenue came last, in Act 6 of 8. Grants and major gifts made up $350,000 of the $450,000 in Year 1, or 78 percent. Major gifts alone were 44 percent, in a roadmap that promised to avoid overreliance on any single funding source. And while it projected revenue three years out, all the way to $750,000, it only ever priced one year of spending.
Then I closed with this: “The numbers here aren’t guesses, they’re based on industry research, local media interviews, and best practices from similar communities.”
I believed that when I wrote it. That’s the point.
The test
Last week, I launched PressViable, a modeling tool I built for people who start, buy, or fund local newsrooms. It sizes a newsroom’s budget and revenue against public data on the market it serves: Census household data, Census business counts, IRS giving data and BLS wages.
So I did the obvious, slightly uncomfortable thing. I entered the Cheltenham roadmap exactly as published. No tuning, no second thoughts.
First, I measured it against Montgomery County, because that’s what most of us do. We reach for the biggest, richest dataset in sight. And it passed easily. The tool scores each earned-revenue line on how big a slice of the local market it would need to win, and both membership and sponsorship came back at 95 out of 100. The roadmap’s $30,000 membership line works out to roughly 250 members at a typical membership level. The tool measures that against what it calls addressable households, the share it treats as realistic prospects for a paid membership based on Census measures of civic stake. In the county, there are more than 200,000 of them. Its sponsorship line needs about 14 sponsors, out of some 4,600 businesses. Rounding errors.
The overall durability score was 93, which sounds great until you remember what it measures. Durability asks whether the budget balances. Mine balanced. Of course it did. I built it to.
Then I changed one thing. Not the plan, the denominator. I measured the same numbers against the three ZIP codes that come closest to Cheltenham’s actual footprint, about 14,200 households.
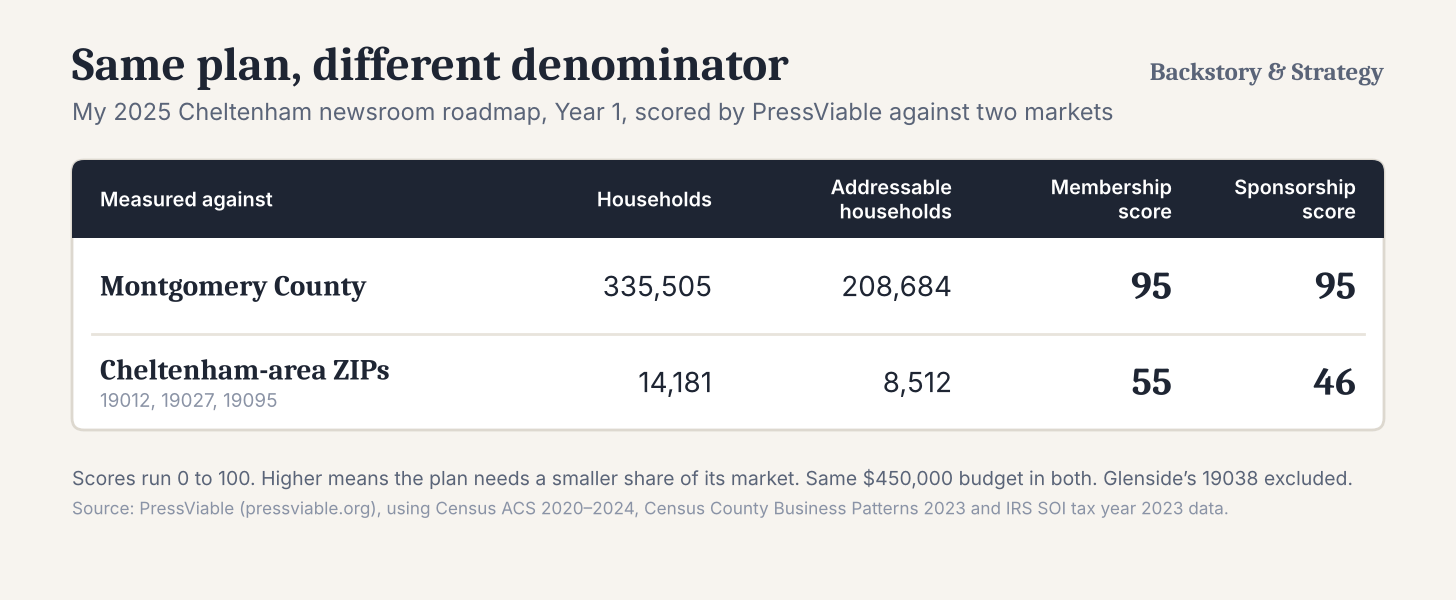
Same plan, same $450,000. Now those 250 members are nearly 3 percent of the roughly 8,500 addressable households, and the sponsorship line needs to sign about one of every nine local businesses in the tool’s estimate. On the tool’s scale, scores in the 90s mean a plan needs only a sliver of its market. Scores in the 40s and 50s mean it has to win a share of a small market that the tool flags as a stretch.
I left out Glenside’s 19038, which reaches well into neighboring Abington. Glenside itself is split between the two townships. Adding a ZIP code that isn’t really yours is exactly the kind of denominator padding this exercise is meant to catch, and it works. With Glenside in, both scores climb back into the high 70s and low 80s.
And those are Year 1 numbers. My roadmap had membership more than doubling, and sponsorship doubling, by Year 3.
None of this is because Cheltenham is poor. By the tool’s measure, built on IRS ZIP code data, the ZIP codes around it rank in the 97th percentile nationally for charitable giving per household. The money is there. The question my roadmap never asked was how much of it a three-person newsroom could actually win, from the town it was written for.
The denominator is a choice
Here’s what unsettles me about that table. Nothing in my roadmap changed. Every number was the number I wrote down. What changed was what I measured it against, and that choice was mine to make.
That’s the trap hiding in the founder sequence. By the time the spreadsheets come out, there’s a plan to protect, and the flattering denominator is always within reach. The county looks rich. The metro looks bigger. The regional benchmark looks reassuring. None of those numbers is false. They just answer a question that a three-person newsroom in one township isn’t actually facing.
A model that can say no starts somewhere else. It picks the denominator first, meaning the households you can actually reach and the businesses that would actually sponsor you. Only then does it ask how many people that market can pay for. The staffing plan comes out of that answer. It doesn’t go in ahead of it.
To be fair to my August 2025 self, the roadmap got some things right. It set aside a $50,000 contingency reserve, about 11 percent of the budget, which would have covered most of a serious salary overrun. And yes, PressViable can be gamed the same way any spreadsheet can. Pick a generous enough geography, and it will tell you what you want to hear. A tool doesn’t fix the sequence. It just makes the choice harder to hide.
Three questions
When PressViable finished with my roadmap, its assessment closed with a list of conditions. One asked me to document the donor and grant agreements behind the $200,000 in major gifts and the $150,000 in grants. Another asked for signed or letter-of-intent commitments behind the $50,000 in sponsorship.
That’s $400,000 of a $450,000 budget, nearly 90 percent of it. I didn’t have a single document for any of it. In a launch budget, a line like “major gifts: $200,000” starts to read like revenue the moment it’s typed. Mine hadn’t been asked for, let alone committed.
That isn’t a knock on founders, or on me in 2025. It’s what happens when revenue is the last thing you plan. So before the next newsroom launches, or the next funder signs on, or the next buyer closes, I’d ask three questions.
Can your model say no? If no set of numbers would change the plan, you have an exhibit, not a model.
What’s your denominator? Measure against the market you’ll actually serve, not the biggest one in the spreadsheet.
Which line carries the plan? Find the one that takes everything with it if it slips, and get the documents behind it first.
If you’re starting, buying, or funding a newsroom and want to run your own numbers, you can request access at pressviable.org. I built it because I needed it. Apparently, more than I knew.
Your turn. If you’ve started, funded, or bought a newsroom, what denominator did the plan use, and which line broke first? Tell me in the comments, especially if your numbers disagree with mine.
About the numbers: The 2025 roadmap’s budget and revenue figures were measured from the charts in the original piece. PressViable’s market figures come from the Census Bureau’s 2020-2024 American Community Survey and 2023 County Business Patterns, IRS individual income tax statistics (tax year 2023), and BLS occupational wage data. The scores are Year 1 results, entered exactly as the roadmap was published.
PS: If you know someone drafting a newsroom plan or a grant application right now, forward this to them before they hit submit. And if it was useful, a restack helps it reach the founders and funders who need it most.